%202.png)
Imagine this: the executive team meeting is about to start. The CEO wants to know customer churn for the last quarter. The analyst promises to deliver the number by tomorrow.
This is the reality of BI in many organisations today. Business asks, IT or the data team builds a report. Sometimes quickly, sometimes weeks later. Always through a bottleneck.
But before we think about the solution, we need to understand where the problem actually lies.
Throughout data history, organisations have tried to build what's called self-service BI. The idea: business people (say, a sales manager who is neither an IT expert nor a data warehouse guru) should be able to explore their own data, build their own dashboards, and get answers to ad hoc questions.
BI and dashboards are usually thought of as charts: bar graphs, pie charts, and everything a designer can dream up. Another analogy is a car dashboard, showing when the fuel runs out or how fast you're going. Then there's Excel, which data people hate as a UI but which every business would love to use to explore their domain's data.
Self-service has never really worked. Few HR managers build their own dashboards in Power BI or Tableau. Two reasons:
First, a philosophical question: how much do we actually need charts or even spreadsheet views? If we want to know customer churn for a given quarter, is a single number enough, or do we need a diagram or table? Maybe we want historical data, but that too could be asked: 'compare to the previous month'.
Ad hoc queries are always specific, never universal. The total number of customers tells us little, but:
This is where enriched data modelling helps. Here's how.
Same question, three different answers. Everyone is correct from their own perspective.
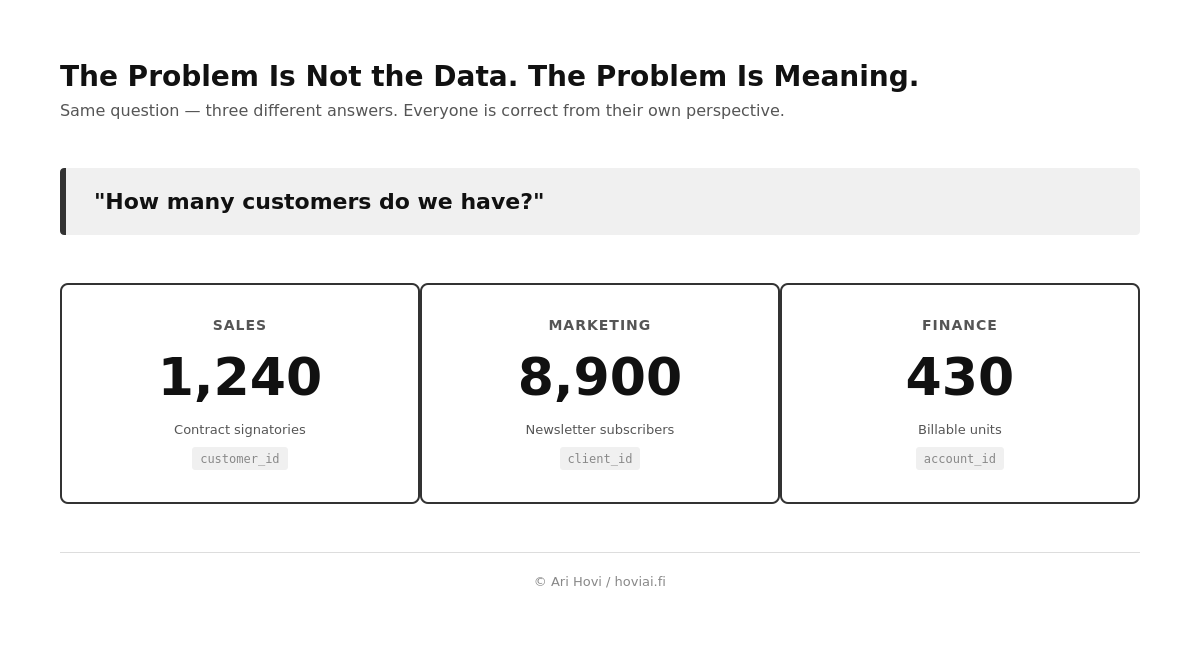
Sales counts those who have signed a contract. Marketing counts newsletter subscribers. Finance counts billable units. In the database, this shows up as three different fields: customer_id, client_id, account_id.
This is not the fault of the data platform. It is not the fault of the BI tool. It is the absence of shared definitions, and that problem repeats itself across every metric. Revenue is booked at the time of order, invoice, or payment, depending on who you ask. With definitions alone, you can double or halve any KPI.
Until you know what you are measuring, your measurements have no value.
The BI industry talks a lot about conversational BI and AI-powered self-service analytics. The vision is compelling: business asks the data warehouse in natural language, 'What was customer churn last quarter?', and gets a direct answer without going through the IT team.
Technically this is already possible. Claude, GitHub Copilot, Microsoft Fabric Copilot: all can translate natural language into SQL and fetch data from Snowflake or other warehouses.
But they fail systematically without one thing: context.
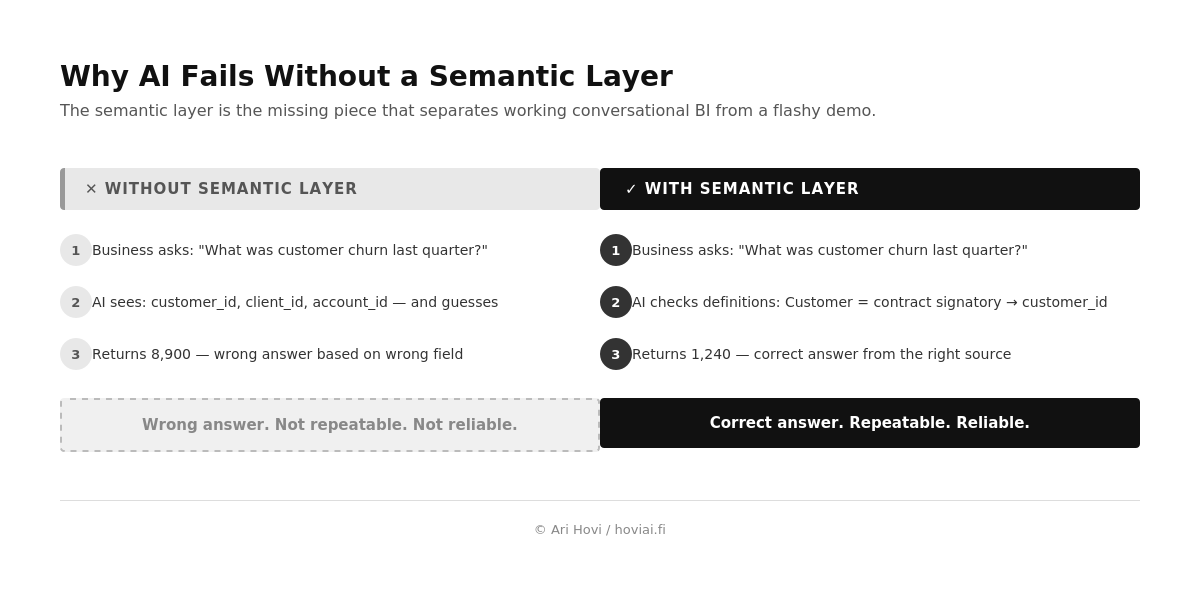
Without a semantic layer, AI sees customer_id, client_id and account_id and guesses. The result might be 8,900, even though the correct answer is 1,240. Wrong answer. Not repeatable. Not reliable.
With a semantic layer, AI first checks the definitions: Customer = contract signatory. Result: 1,240. Correct. Repeatable. Reliable.
The semantic layer is the missing piece that separates a working conversational BI from a flashy demo.
This is confirmed by Anthropic (one of the world's leading AI companies) from their own internal use: they automated 95% of analytics queries using Claude, but only after building a semantic context layer. Without it, accuracy was 21%. Claude is also the final layer in the solution described in this post, the one that queries the data. Link to Anthropic's article at the end.
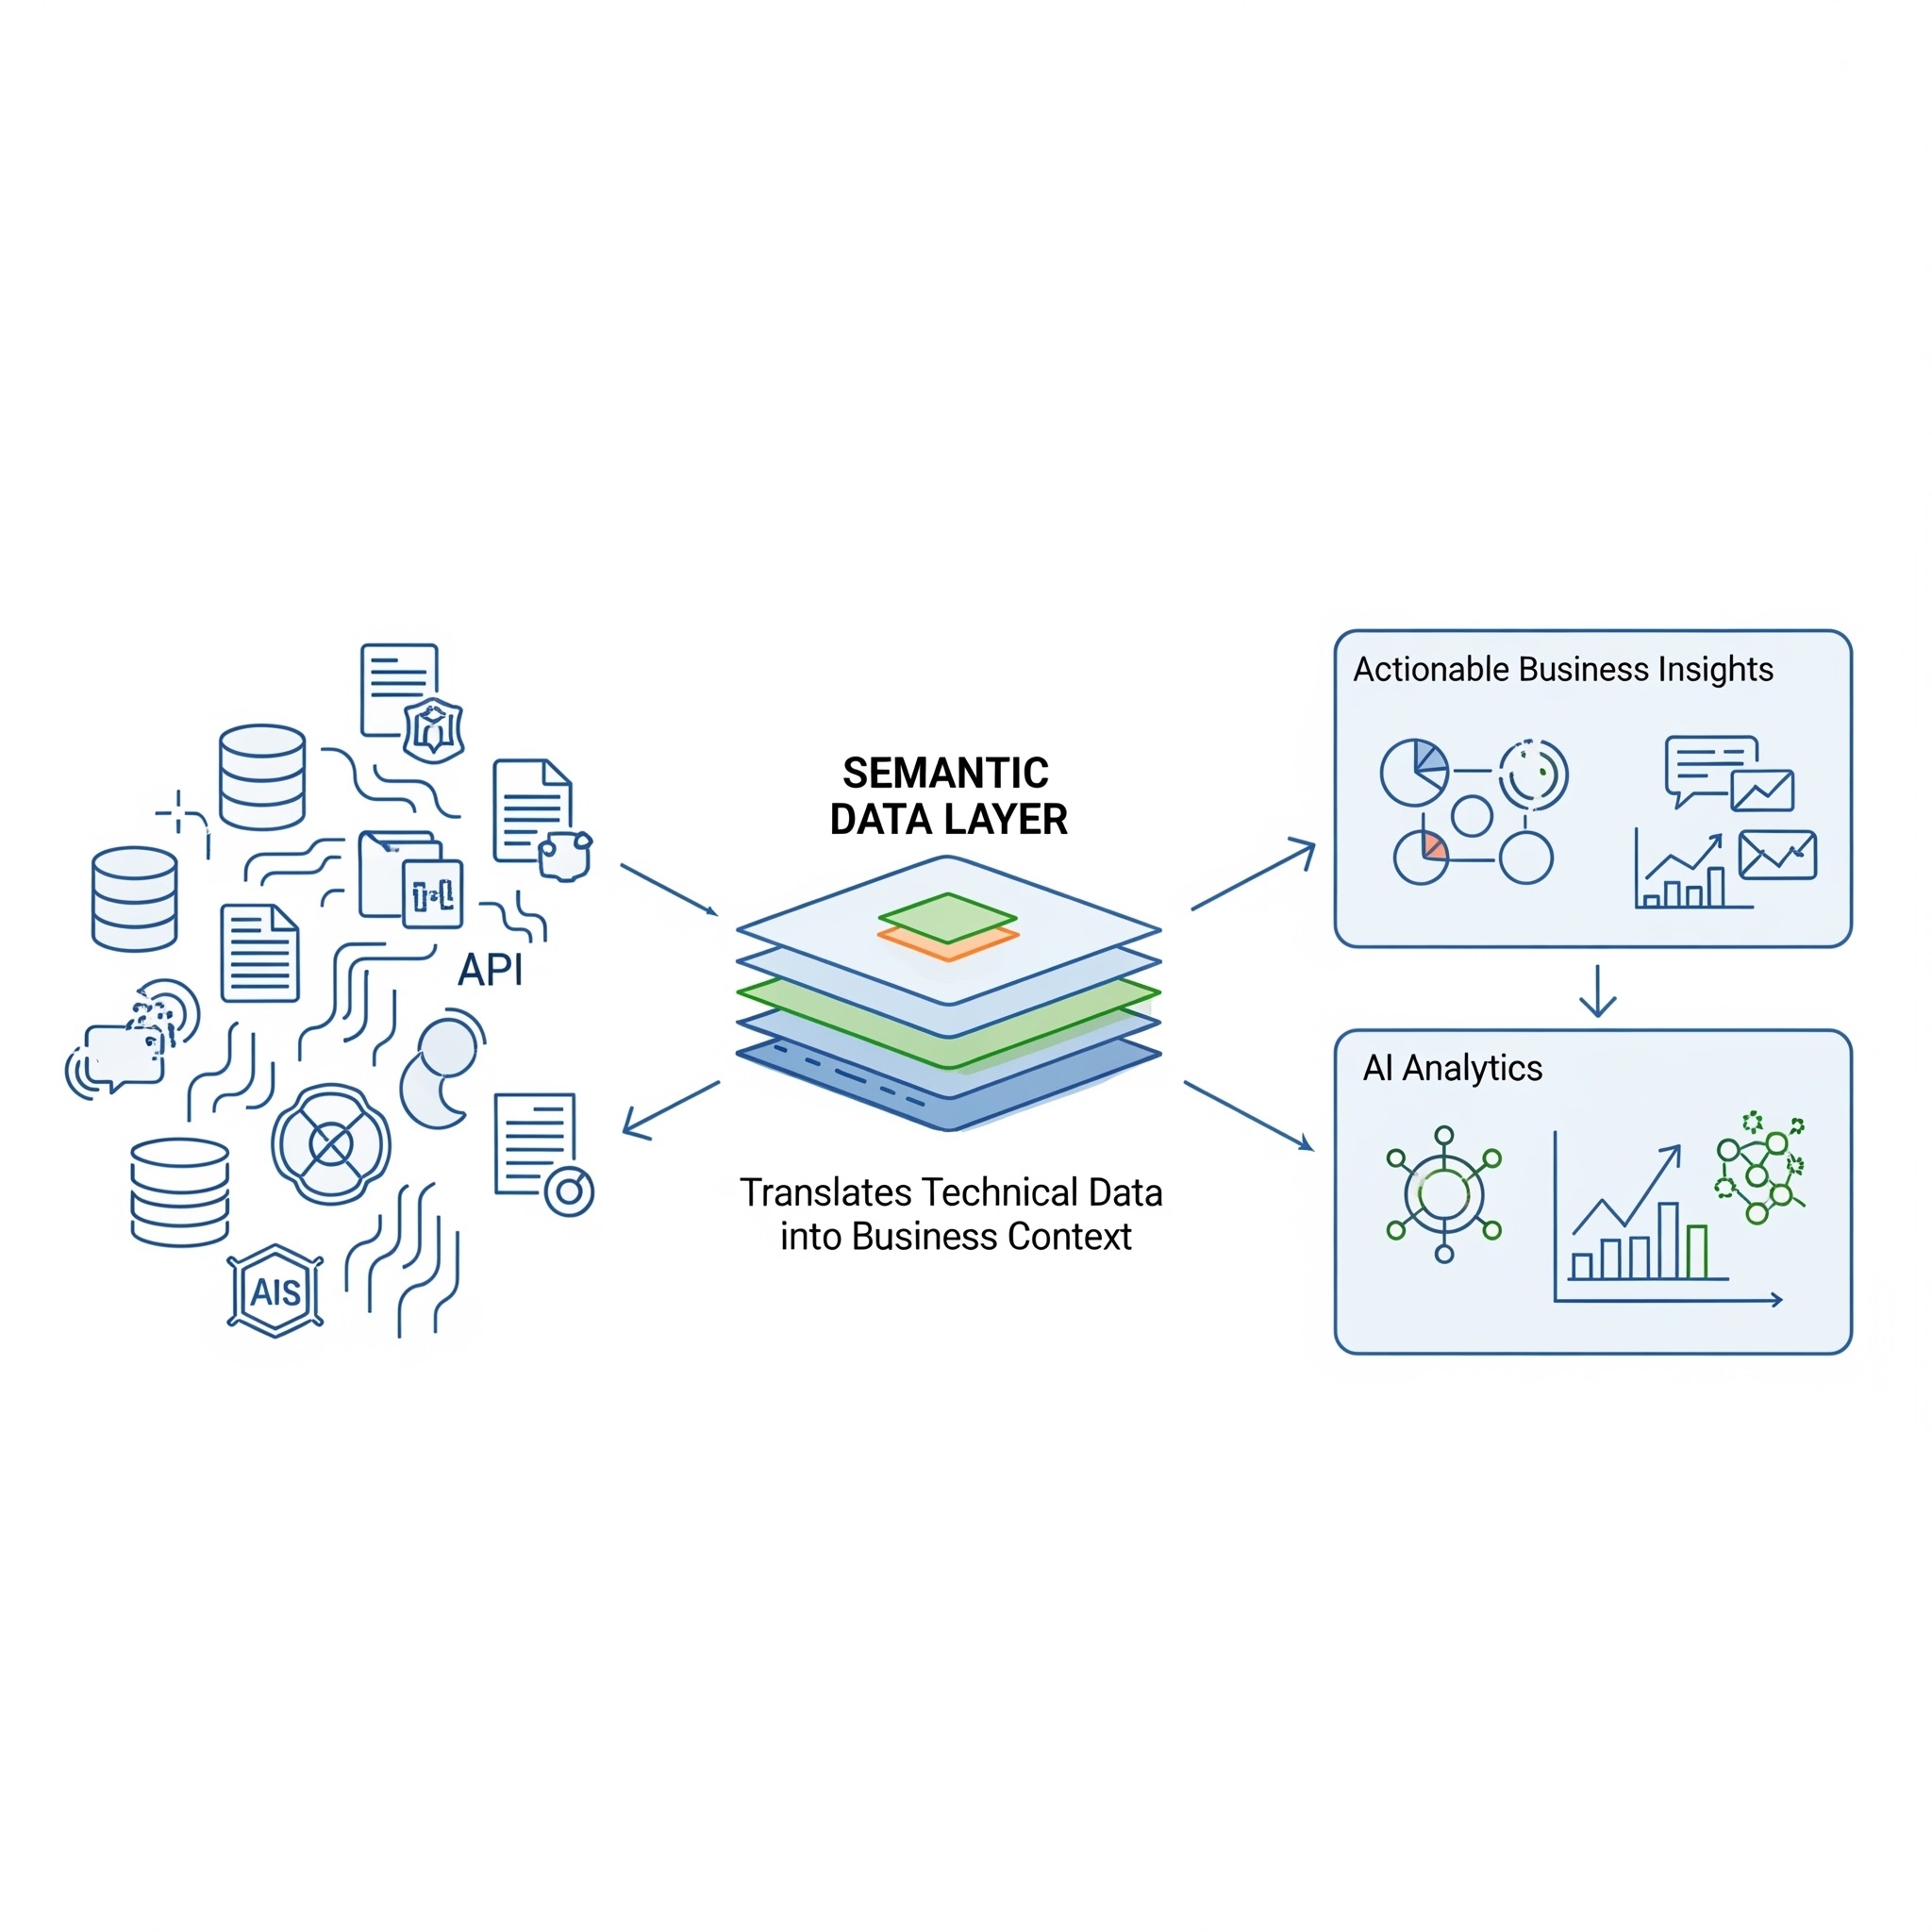
The semantic layer is the layer in data architecture that bridges physical data and business meaning.
Bottom up: source systems hold raw data with no context. The semantic layer is where the essential work happens: concept models, definitions, metadata, ownership and relationships are connected to physical data. On top of this layer, both BI and AI use the same definitions. No more conflicting numbers. No more guessing AI models.
When people hear 'data model', most think of a physical schema: tables, columns, indexes. This post is about something more developed. Let's call it an enriched data model, because it is broader. It includes concept definitions, KPIs and their calculation logic, results from business interviews, ownership information, and the mapping of physical tables to concepts. It is a combination of technical structure and business context, and that context is exactly what AI needs.
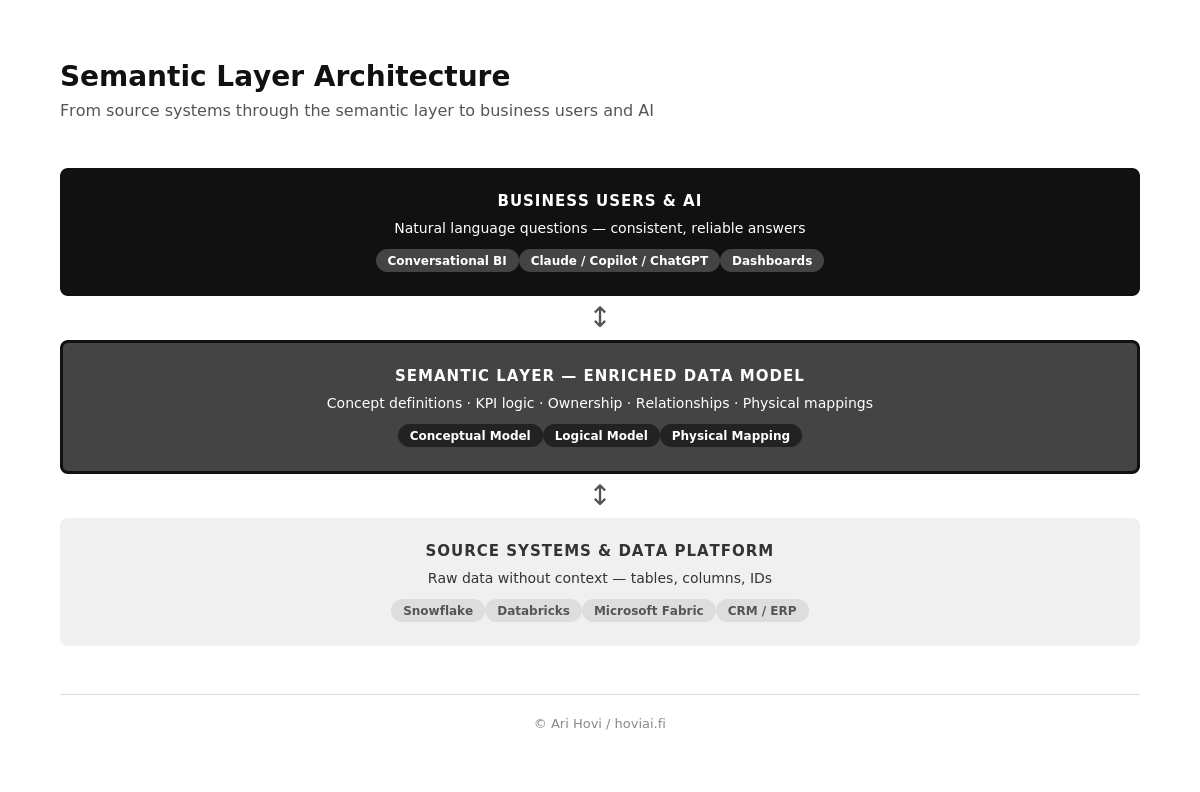
A semantic layer does not come from a tool. It comes from a modelling process that moves from the concept level to the physical data.
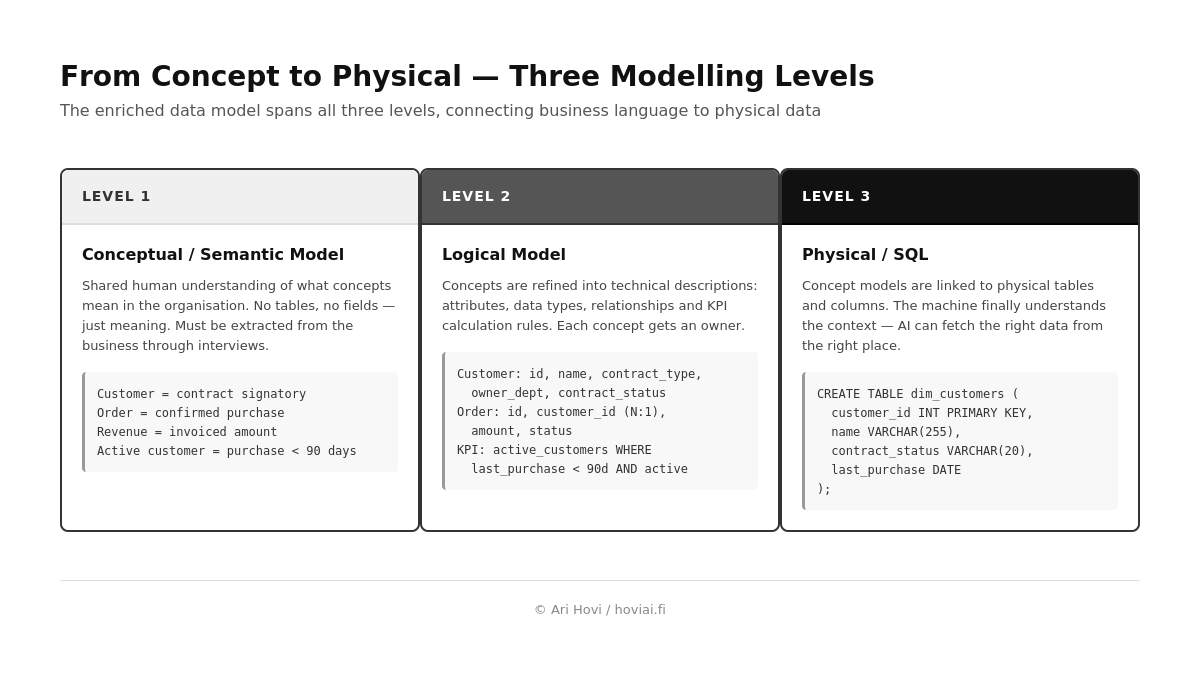
The shared human understanding of what concepts mean in the organisation. We are not yet talking about tables or fields; we are talking about what 'customer', 'order' and 'revenue' mean. This knowledge must be extracted from the business through interviews. A workshop or interview must happen. There is no shortcut.
Refines the concepts into technical descriptions: attributes, data types, relationships. Customer gets fields id, name, contract_type, owner_dept. Order relates to Customer in an N:1 relationship. A critical addition: KPIs and their calculation logic are written out here. 'Active customer' = customer_id WHERE last_purchase < 90 days AND contract_status = active. This is the business dictionary that is fed to AI as context. Every concept and KPI also gets an owner responsible for keeping the definition current.
Concept models are linked to physical tables and columns. CREATE TABLE dim_customers, naming conventions, indexes. At this stage, the machine finally understands the context, and AI can fetch the right data from the right place with the right conditions.
These three levels are defined only to make the process clear. It is not linear; it is more of an iterative 'top-down and back up' process.
One of the most common mistakes in building a semantic layer is starting with technology. In a meeting someone asks: 'What tool do you use?' Comparisons are made, and before anything has been built, you're in a procurement process, thinking about scaling before you know what you're scaling.
This is the wrong order. Start with an MVP: something that does roughly what you want to achieve. Users get minimal value, but you learn quickly what works.
If you already have a data platform (Snowflake, Databricks, Microsoft Fabric or other) you have more than enough to get started. The platform's existing metadata, table structures and descriptions are good starting points. dbt YAML files are one way to document this metadata, but not the only way.
First, you learn which concepts are genuinely problematic, especially where people disagree. Those are precisely the concepts where a semantic layer is most needed.
Second, you learn how much work it actually requires. A concept modelling workshop to agree on the definition of 'customer' might take three hours. With today's tools and techniques, the process is not as long or painful as many assume.
Third, you learn what a tool actually needs to do. Once you've done it manually, you know what to automate, and you won't buy features you don't need.
When the manual version starts feeling too heavy to maintain (models are hard to connect, version updates become difficult, sharing is hard because everything is scattered, ownership is unclear, linkages to tables break with updates) that is when it is time to look at tooling.
My own philosophy: many different tools and techniques can reach the same outcome.
I should be transparent: I am one of the founders of Ellie.ai, a data modelling tool, so I cannot give an objective assessment of which tool best suits this purpose. I am deliberately leaving that for you to evaluate.
The point of this post is not to recommend a tool, it is to describe the process and approach. The tool is secondary. It comes after you know what you need. I will use Ellie.ai as an example tool here. The same can be done with other tools.
The term 'semantic layer' originally referred to BI tools' metric layers; it is not a new term. So one candidate is the BI tool itself. However, BI tools are not designed as business glossaries or for conceptual modelling.
Snowflake, Databricks and Microsoft Fabric are all building their own semantic layers. Snowflake talks about Semantic Views, Databricks about Unity Catalog, Fabric about Copilot and the Power BI dataset layer. These are good and worth using if they're already in place.
The limitation is clear: they are platform-bound. When multiple environments come into play (Snowflake, SaaS systems, legacy data) meaning fragments again. They also focus on defining metrics and dimensions, not so much on business concept models and relationships between concepts.
One option is dbt YAML files, where semantic metrics can also be recorded. But those definitions are written by data engineers in YAML — a technical artefact that business cannot maintain. So that too is insufficient on its own.
Ellie.ai contains different modelling levels, including the concept model, logical and physical levels, and is designed specifically for maintaining concepts and terminology. Ellie.ai can also read Snowflake or Databricks tables and map them to business terms. It allows you to automate a large part of what was once a laborious concept modelling process, using AI.
Many international companies use Ellie.ai for exactly this purpose, often alongside data catalogues. In the public discussion around semantic layers, data catalogues frequently come up — and that's natural, as they store a lot of the necessary metadata.
Many organisations already maintain KPI definitions and concept descriptions in a data catalogue: Collibra, Atlan, Microsoft Purview or similar. That is a good starting point and valuable work. But a data catalogue and a semantic layer are not the same thing.
A good analogy: imagine building an IKEA table. A data catalogue is the list of screws, bolts and tabletops, and perhaps instructions for where to find them in the warehouse. That information is important and necessary. But it doesn't yet tell you how to assemble the table.
The semantic layer, or enriched data model, is the assembly guide. It explains how the parts connect, in what order they are joined, and what the result should look like. Without the assembly guide, you can have a perfect parts list, but the table doesn't build itself.
A data catalogue tells you what exists. A semantic layer tells you how things relate to each other, and that is exactly what AI needs.
This is an example of how a semantic layer can be built in practice. Important: this does not require a specific technology; the same approach works on Databricks, Snowflake, Microsoft Fabric or any other data platform.
The first, and most important, step is the interview. Run a workshop or one-to-one interviews with the people who know the business logic. The goal: understand what variables make up a given KPI, what calculation rules apply, what exceptions and constraints exist. This knowledge often lives in people's heads. It may have been written down somewhere, but it still needs to be verified with the business to confirm it is current. No technology, method or concept gets you out of this. You have to talk to the business.
The business logic gathered in interviews is documented in a structured way in a data modelling tool. The semantic model describes the concepts, their relationships and KPI calculation rules. This way the knowledge does not remain case-specific; it becomes an explicit, reusable definition that the business can read and own.
The data modelling tool is connected to the data platform's database and reads its structure: tables, columns and technical relationships. Important: the actual data does not move anywhere. The tool only processes structure. If a direct connection cannot be established for security reasons, the client can provide SQL CREATE statements manually.
The client's chosen AI provider (Claude, OpenAI or other) is connected to the data modelling tool's MCP server. AI now has access to both the semantic model and the database structure. Business can now ask in natural language in chat: 'What is customer churn for the last quarter?' and get a reliable answer without going through the data team.
The semantic layer is not a technology project. It is a business documentation project with a technical implementation.
Theory is good. But the best way to convince yourself, and your leadership, is to try it. A proof-of-concept (POC) is not a big project. It is a scoped test where an enriched data model is built for one business concept. If you need help presenting the POC or convincing business stakeholders, I am happy to help.
A good POC does not try to solve everything at once. It picks one critical problem, proves that the approach works, and gives a clear recommendation for next steps. We can help with this, but it can also be done independently.
The starting point is always the enriched data model, not technology. Choose one scoped business question, build an enriched data model for it together with the business, and test: does AI give a reliable answer? If yes, the approach works and you can think about scaling.
Test: ask AI the same question twice: first without context, then with the enriched data model. The result tells you everything.
The BI industry is at a turning point. Data platforms like Snowflake, Microsoft Fabric and Databricks have built the infrastructure. AI tools like Copilot, Claude and Gemini are ready to query data for answers.
What most organisations still lack is the semantic layer that connects these two worlds: the technical data infrastructure and the language of business.
I want to emphasise one more thing: building conversational BI cannot succeed without the active participation of the business. A sales manager, for example, must be involved in defining what the key concepts mean. Building a semantic layer is based on the systematic documentation of business and domain definitions, not just technical modelling.
Engaging the business works best when you don't use technical language or data-industry jargon; you use the business's own language. For example, to a sales manager:
'We are building an analytics solution where you can ask AI directly: What was customer churn last quarter? Or: What were the per-customer margins in 2025? You get the answers through chat, without needing to build reports or search for numbers across different systems. But for this to work correctly, we need to define together what churn, margin, active customer and sales mean in our business.'
Organisations that build the semantic layer now, before AI investments scale further, will have a significant head start in one or two years' time.
Those without a semantic layer will run into the same problem as before: AI guesses, numbers conflict, and the business does not trust the data.
Johannes Hovi | Growth Director, Ari Hovi. Co-founder of Ellie.ai. Writes about data architecture, semantic modelling and AI in the BI context.
Further reading:
• Anthropic: How Anthropic enables self-service data analytics with Claude